Help Topics
Creating and Modifying an Insight
To create a new report, click the “New Insight” button in the upper left.

Clicking on an Insight will present the form below, that allows you to choose specific criteria to tailor the Insight to your requirements. Clicking Edit will expand the options, allowing you to change any aspect of the report.

From here you can assign your Insight report a title, and set the four properties: Filters, Group By, Calculations, and Columns, that define how it behaves.
Filters
Filters are used to include or exclude Cases/Records that you specify. To do this select from the criteria available. For example, you might make a report that only presents Records/Cases that are currently open. In this instance, under Filter, the Field column would be “Status”, the Operator column would be “Equals”, and the Value would be “Open”.

Another filter example would be to only filter records created at the beginning of the week, month or the current quarter. To do this, in the Operator drop down, choose Greater Than. Next, click the Relative radio option and a new drop down box will appear and select the option you need.
Group By
Grouping entities of your report will help you compare different properties. For instance, in the example below, you might decide to group results by their severity.

Calculations & Calculation Totals
Calculations allow you to pull summary information from your data. You can count numbers, add totals, and calculate the minimums and maximums within data. You can further break down calculations by grouping within larger insights groups.
Calculations from other insights
You can include calculation results from other insights into your insight, provided they a grouped in the same way.
Calculation Totals
Calculation totals allow you to combine multiple calculations together into larger totals, or subtract values.

In this example, a "Per Day" calculation breaks down the number due by region. The total due is also calculated. This then pulls the calculations from "Records By Closed" to calculate a net value.
Columns
As implied, this determines which columns are saved in the Insight report.

To add a column, use the dropdown list. You can drag each column around to change the order they are displayed by clicking and holding your mouse button down on the 6 dots.

To remove a column, click on the X

Formatting Columns
You have a number of options available to format the column, and you can access these options by clicking on the formatting icon as shown here:

When you've clicked on the formatting icon, you'll see a popup with the options to add, modify and delete any formatting. Clicking Add Rule will present you with the formatting options.

Conditions
The Condition dropdown will change and present further options based on what information that column has.

Background Color
This allows you to change the background color of the table cell when displaying the insight

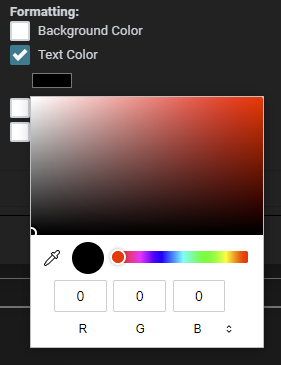
Text Color

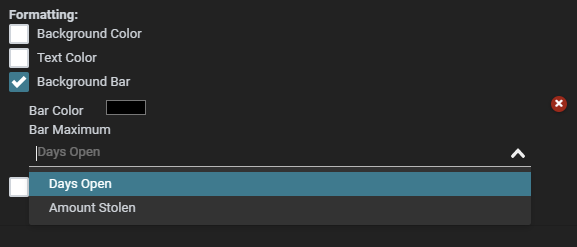
Background Bar
This allows you to show a visible bar based on a percentage as the background of the cell. The Bar Maximum options shows the calculations that are available which you can use. You can also set the color of the bar.

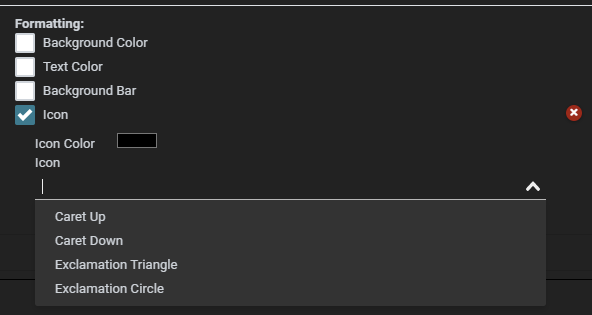
Icon
This option allows you to show a graphic in the cell to indicate or highlight the data being shown. You can also set the color of the icon.

Saving the Insight
After populating these four properties, click the “Save” button to add this Insight to your list of saved reports on the left side.

Deleting the Insight
To delete an Insight click on the red Delete button, as shown in the image below.

As an extra precaution, you'll be presented with a pop-up dialogue box asking you to type in the name of the Insight to confirm it's removal. Once deleted, this cannot be undone.

Comments
0 comments
Please sign in to leave a comment.